
Signal To Noise Ratio Deconstructed
One of the most important technical specifications of analog and digital audio equipment is the signal to noise ratio. But it’s also one of the most misunderstood. Here’s a closer look at some of the possible problems with the definition of the SNR and it’s close relative, dynamic range.
To make one thing clear first: the SNR as a specification is still a valid measurement to compare different pieces of audio equipment and get an idea of their quality. But it’s also easily misinterpreted and thus sometimes leads to false assumptions. I even walked into that trap myself before. But fortunately, it’s an uncritical trap to walk into, as it leads to overestimating requirements rather than underestimating them. As we will see, the “real” signal to noise ratio when taking into account how our hearing works, is much better.
Signal To Noise Ratio Definition
Let’s first have a look at the exact definition of SNR. It’s the level of noise power that an audio device generates at its output, in relation to the power of a predefined reference signal. This reference signal is usually a 1 kHz sine wave with a level of +4 dBu. So if the noise power at the output of a device is at -100 dBu, it has an SNR of 104 dB.
A very similar specification is that of the dynamic range, which is related to the maximum signal level that the device can reproduce without exceeding a certain limit on signal distortion. But here too, “signal” means a 1 kHz sine wave.
So in essence, we compare sine waves with noise. Or in other words, apples with oranges.
Apples vs. Oranges
There are several problems with this definition. First, only considering the total noise power doesn’t tell us anything about the spectrum of the noise. But that’s a rather small problem since in practice we deal with flat white noise in most cases. However, keep in mind that there’s more types of noise than white noise.
The real issue is that a sine tone and noise lead to totally different results when analyzing their spectrum. And that’s what our ears actually do all the time.
Upon spectral analysis, a sine wave or any periodic wave (= a tone) will always be visible as peaks in the spectrum with a certain level, no matter how the analysis is done. With noise however, the result depends on the frequency resolution of the analysis, as we’ll see in the following.
An Example
Now let’s have a look at a practical example of what SNR actually looks like to our ears. This is the spectrum of a 1 kHz sine wave with white noise added to it. In this case, both the sine and the noise signal have been normalized so that both have an RMS power of 0dBFS. According to the definition, this example has an SNR of 0dB.
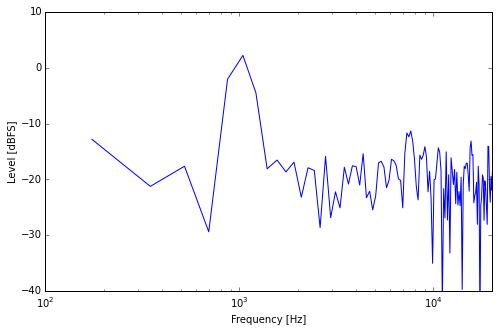
Sine + Noise, Small Window
What you can see is that although both signals have the same power, the peak caused by the sine component stands out very clearly. Looks like it’s about 15dB louder than the “noise floor”, which is quite a lot.
But there’s something important to consider about spectral analysis. What you see above is done by looking at a short time slice and analyzing it for its frequency content. And the length of this time slice directly influences the frequency resolution of the analysis, which means the number of frequencies we can distinguish from each other. In this example, the time slice is around 6ms long.
Now look at what happens if we double the length of the slice and thus the frequency resolution.
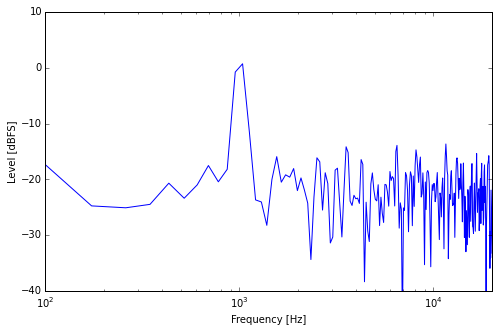
Sine + Noise, Medium Window
You see that the frequency resolution is finer. The sine peak is narrower and the noise floor is also finer. But while the level of the sine peak stays around the overall level it had before, it looks like the “noise floor” level was decreased a bit. Let’s double the resolution again.
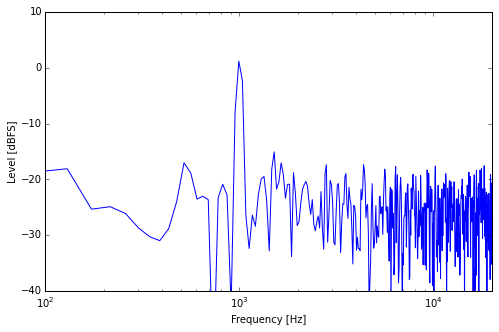
Sine + Noise, Long Window
Now we are analyzing a slice of about 24 ms, which brings us close to the resolution of our ears at lower frequencies (the ears do their spectral analysis business in a much more complex way than this simple example). Again, the resolution has become finer and the average level of the noise part went down a bit while the sine peak remains at the same level.
The explanation is actually quite simple and intuitive. While the power of the sine tone concentrates at 1 kHz, no matter how long a slice we cut out of it, the power of the white noise is distributed equally across all the frequencies that we are analyzing. If we double the number of frequencies, the noise power is distributed across twice as many frequencies. So there’s on average half the noise power at each individual frequency. Half the power means 3dB less amplitude. So you see that with each doubling of the frequency resolution, the average noise floor level goes down by 3dB.
Conclusion
Now you know the fundamental difference between tones and noise when it comes to spectral analysis. As you can see, the spectral analysis performed by our ears can serve as a kind of noise reduction algorithm which increases the average signal to noise ratio across the hearing range. A rough number for this noise reduction is around 15-20 dB.
You’ve also seen that the technical definition of SNR is like comparing apples and oranges. It still serves well as a standardized specification to compare the quality of different devices. But apart from that, there’s not much more to interpret.
But most importantly, I wanted to bring you this example to make clear how different tones and noises really are.